The main Visitors Card at the top of this page contains powerful interactive graphs to help you understand your real audience's behavior.
Using the dropdown filter on this card, you can analyze your traffic from four different
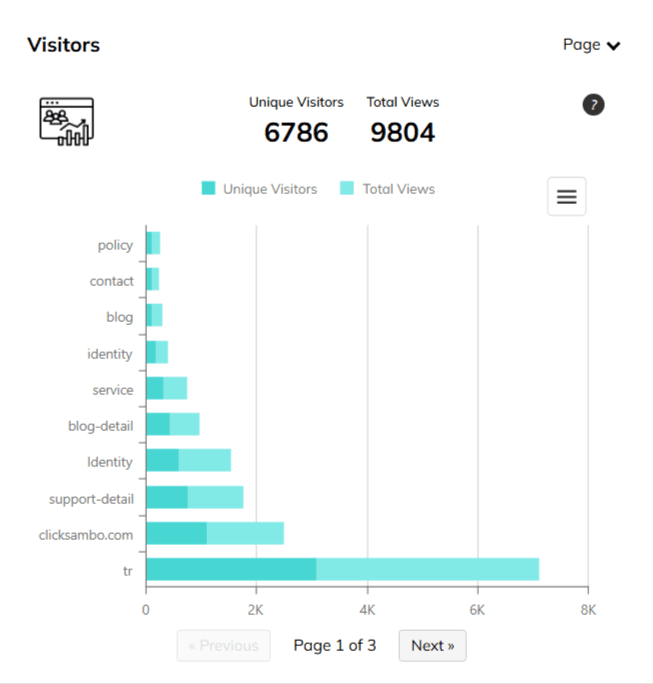
This view displays a breakdown of your top pages, showing you which ones receive the most unique visitors and total page views. It helps you identify your most popular content and landing pages.
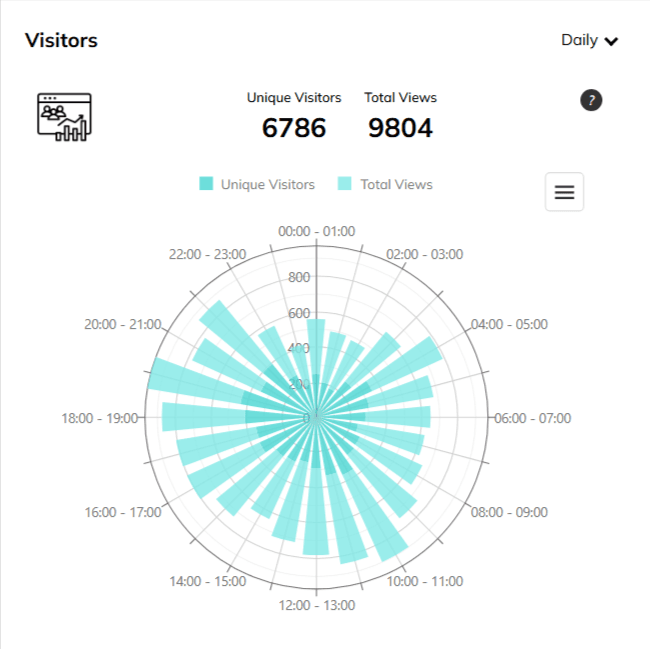
This graph breaks down your website traffic by the hour of the day. It allows you to see the exact times your site is busiest and when traffic is lowest.
Identify your peak traffic hours to inform your advertising strategy. For example, if you see most of your high-quality traffic arrives between 6 PM and 9 PM, you can use Google Ads' "Ad scheduling" feature to bid more aggressively during those hours, maximizing your budget's impact.
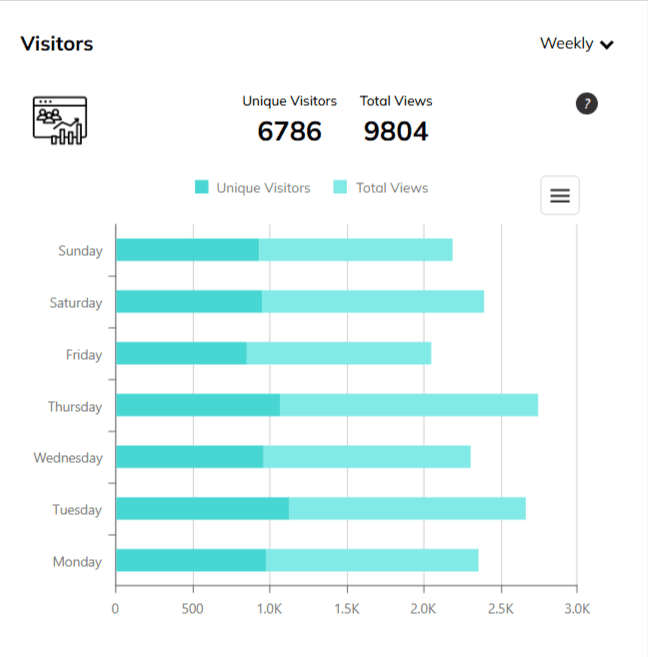
This view displays your traffic patterns across the days of the week (e.g., Monday, Tuesday, etc.).
Discover which days your audience is most active. If you run an e-commerce store and see that Saturdays are your busiest day, you can plan promotions to run on that day. For B2B businesses, you might see that weekday traffic is much higher, helping you focus your efforts when your customers are online.
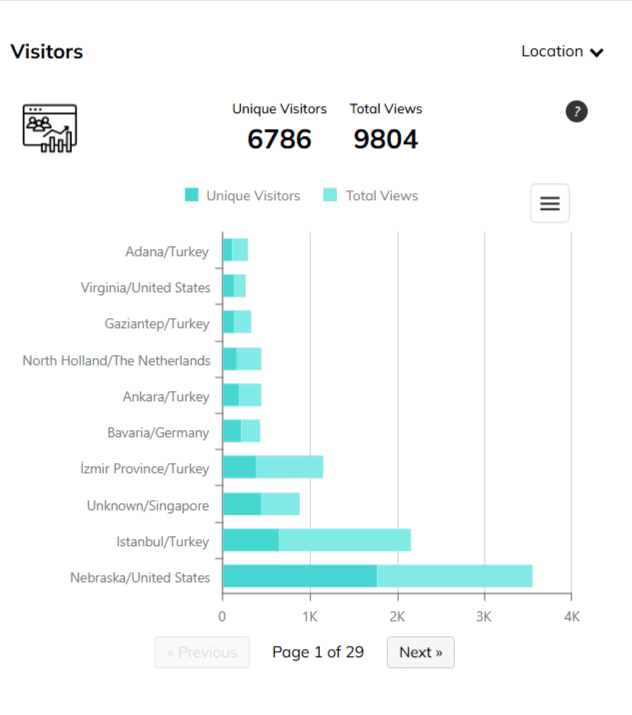
This provides a geographical breakdown of your legitimate website visitors, showing which countries or regions are driving the most traffic.
Confirm that your ad spend is attracting visitors from your target markets. This view can also help you identify emerging markets where you have unexpected popularity, potentially informing future expansion or new ad campaigns.
By using these different views, you can gain a deep understanding of who your real customers are, when they are most active, and what content they are interested in.
Protect your marketing budget and increase revenue with ClickSambo
Start TrialAnalyze your account and uncover losses caused by fake clicks.
Get Free Report
Reach us easily via WhatsApp, live chat, or email.
Contact UsJoin our partner program and turn ad-fraud protection into a scalable, recurring revenue stream.